RTSR Definition: Understanding Relative TSR
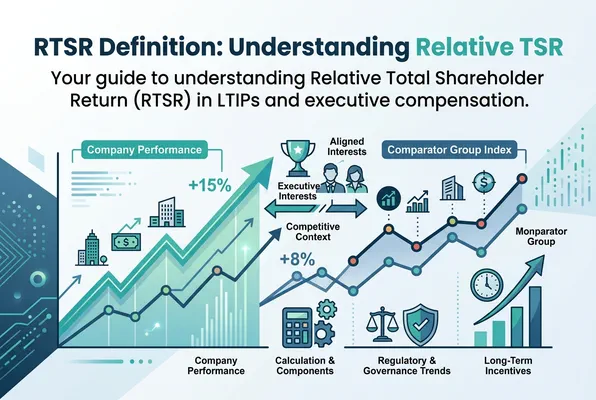

Relative Total Shareholder Return, commonly known by its acronym RTSR, has become one of the most influential performance metrics in modern executive compensation. If you work in HR, finance, investor relations, or corporate governance, understanding the full RTSR meaning is essential for designing fair, transparent, and market-competitive long-term incentive (LTI) plans.
This comprehensive guide explains everything you need to know: what RTSR means, how it is calculated, how it is structured in incentive plans, and what its strengths and limitations are. We also explore best practices for companies looking to integrate RTSR into their compensation frameworks.
What Does RTSR Mean?
People searching for the definition of RTSR often encounter unrelated results. Queries such as define RTSR, Red Tearstone Ring, Ring in Dark Souls, or Dark Souls Wiki refer to a gaming item rather than Relative Total Shareholder Return. Although both use the same abbreviation, they describe completely different concepts.
RTSR stands for Relative Total Shareholder Return. It is a performance metric used primarily in long-term incentive plans (LTIPs) to evaluate how well a company’s stock has performed compared to a defined set of peer companies or a market index over a specific measurement period, typically three years.
The word “relative” is the key differentiator. Rather than simply measuring whether a company’s share price went up or down in absolute terms, RTSR compares performance against a benchmark. This matters enormously: a company whose stock rose 10% during a period when all its peers rose 30% would rank poorly under RTSR, despite delivering positive absolute returns. Conversely, a company that declined only 5% while peers fell 20% would rank strongly.
Why “Total” Shareholder Return?
The “Total” in RTSR refers to the fact that the calculation accounts for both share price appreciation and dividends reinvested over the performance period. This gives a more complete picture of the value delivered to shareholders compared to using share price movement alone.
The Three Core Elements of RTSR
- Starting and ending share price — usually averaged over a 30- to 90-day period to reduce the distortion caused by short-term market volatility.
- Dividends paid — assumed to be reinvested into additional shares at the time of payment.
- Peer group or index benchmark — the competitive reference against which a company’s TSR is ranked.
Why RTSR Has Become a Central Executive Compensation Metric
Over the past two decades, institutional investors, proxy advisors, and regulators have pushed strongly for a closer link between executive pay and shareholder outcomes. RTSR emerged as a popular answer to this demand for several reasons.
Alignment with Shareholder Interests
Since TSR directly reflects the return experienced by shareholders, using it as a yardstick for executive pay creates a direct line between leadership decisions and investor outcomes. When executives are rewarded for outperforming peers, they are incentivized to drive shareholder value more aggressively than their competitors.
Competitive Context
A pure absolute TSR target can be misleading during bull or bear markets. A CEO whose company’s stock rises 20% in a year where all comparable companies rise 40% has arguably underperformed competitively, even though shareholders did well in absolute terms. RTSR removes this ambiguity by grounding performance in competitive context.
Proxy Advisor and Investor Support
Major proxy advisory firms such as ISS (Institutional Shareholder Services) and Glass Lewis view RTSR positively as an executive compensation metric because it demonstrates that boards are holding management accountable to the market, not just to internal financial targets.
Regulatory and Governance Trends
In many jurisdictions, governance codes now strongly encourage companies to include at least one externally-referenced performance condition in their long-term incentive plans. RTSR satisfies this requirement by its very nature.
How RTSR Is Calculated: A Step-by-Step Breakdown
Understanding the RTSR calculation process is critical for compensation professionals, plan participants, and investors alike.
Step 1: Define the Performance Period
The most common RTSR measurement window is three years, though two-year and four-year periods are also used. The start and end dates must be clearly defined in the plan rules.
Step 2: Determine Starting and Ending Share Prices
To avoid manipulation or distortion from a single day’s trading, most plans use an averaging period — for example, the average closing share price over the 30 or 90 trading days before the start and end of the performance period.
Step 3: Account for Dividends
All dividends paid during the performance period are assumed to be reinvested in additional shares at the ex-dividend share price. This builds the “Total” component of TSR into the calculation.
Step 4: Calculate Individual TSR for Each Peer Company
The formula for TSR is:
TSR (%) = [(Ending Share Price + Reinvested Dividends - Starting Share Price) / Starting Share Price] × 100
This calculation is applied consistently to both the subject company and each peer company in the comparator group.
Step 5: Rank All Companies by TSR and Determine Percentile
Once every company’s TSR has been calculated, they are ranked from lowest to highest. The subject company’s position is then expressed as a percentile rank within the peer group.
Example: A peer group contains 20 companies. - The subject company ranks 15th highest out of 20. - Percentile rank = (15 – 1) / (20 – 1) × 100 = approximately 74th percentile.
Step 6: Apply the Payout Curve
The percentile rank is matched against a pre-defined payout schedule to determine the proportion of the equity award that vests.
Typical RTSR Payout Structures in LTI Plans
Most companies structure their RTSR payout curves with three key reference points: threshold, target, and maximum.
| RTSR Percentile Rank | Typical Payout as % of Target Award |
|---|---|
| Below 25th percentile | 0% (no payout) |
| 25th percentile (Threshold) | 25% – 50% |
| 50th percentile (Target/Median) | 100% |
| 75th percentile or above (Maximum) | 150% – 200% |
Performance between these key points is typically interpolated on a straight-line basis.
The Median as a Governance Anchor
Setting 100% payout at the 50th percentile (median) is considered best practice by most governance bodies. It ensures that executives receive target compensation only when their company performs at or above average compared to peers, a reasonable and defensible standard.
High-Performer Caps
Many companies cap maximum RTSR payouts at 150% or 200% of the target award to prevent windfall gains in situations where a narrow peer group happens to perform very poorly, inflating the company’s relative rank.
Choosing the Right Peer Group for RTSR
The selection of the comparator group is arguably the most critical design decision in any RTSR plan. The wrong peer group can undermine the entire purpose of the metric.
Common Peer Group Approaches
1. Custom Peer Group A curated list of direct competitors of similar size, industry, and geography. This is the most targeted approach but requires careful governance and annual review to manage for mergers, delistings, and industry shifts.
2. Broad Market Index Comparing TSR against a major index like the S&P 500, FTSE 100, or Russell 2000 is simple, transparent, and eliminates the risk of peer group manipulation. However, it may not reflect the company’s true competitive landscape.
3. Sector or Industry Index Using a sector-specific index (e.g., MSCI World Energy Index) strikes a balance between specificity and objectivity. It removes broad macroeconomic effects while keeping the comparison relevant.
Key Criteria for Peer Group Selection
- Industry relevance — peers should face similar market dynamics.
- Size comparability — companies with dramatically different market capitalizations may have different TSR dynamics.
- Geographic overlap — international comparisons can introduce currency effects.
- Stability — the peer group should remain broadly consistent over the performance period to maintain fairness.
RTSR vs. Absolute TSR: Key Differences
Many companies use both relative TSR (RTSR) and absolute TSR within the same LTI plan — either as separate metrics or as an overlay — because they serve complementary purposes.
| Dimension | RTSR | Absolute TSR |
|---|---|---|
| Measurement basis | Compared to peers or index | Standalone stock performance |
| Market environment neutrality | High — removes macro tailwinds/headwinds | Low — affected by bull/bear markets |
| Shareholder alignment | Strong | Very strong |
| Threshold risk | Can pay out during market declines | Only pays when stock rises |
| Simplicity | Moderate | High |
Using RTSR as a Modifier or Gate
Rather than using RTSR as a standalone performance metric, some companies use it as a modifier (adjusting the final payout up or down) or as a vesting gate (requiring minimum RTSR performance before any award vests, regardless of other metrics). These approaches add nuance and help prevent situations where executives earn large bonuses despite poor shareholder returns.
RTSR in Practice: How It Fits Within a Broader LTI Framework
Most sophisticated executive compensation programs use RTSR as one of multiple LTI performance metrics rather than as the sole driver of equity vesting. A common split might look like:
- 50% of LTI award tied to RTSR
- 25% tied to Earnings Per Share (EPS) growth
- 25% tied to Return on Invested Capital (ROIC)
This balanced approach rewards executives both for delivering competitive shareholder returns (RTSR) and for driving strong underlying business fundamentals (EPS, ROIC, revenue growth).
Performance Share Units (PSUs) and RTSR
RTSR is most commonly delivered through Performance Share Units (PSUs) — equity awards that vest contingent on achieving specified performance conditions over a multi-year period. The number of PSUs that ultimately vest is determined by applying the RTSR payout percentage to the initial grant.
Example: - An executive receives 10,000 PSUs with RTSR as the sole vesting condition. - At the end of the three-year performance period, the company ranks at the 70th percentile. - Using linear interpolation between 50th percentile (100% vesting) and 75th percentile (200% vesting), the payout is approximately 180%. - The executive receives 18,000 shares.
Participant Eligibility and Corporate Actions
Every long-term incentive plan should clearly specify who is eligible to participate and who becomes the recipient of equity awards. During the performance period, corporate actions such as share buybacks, capital increases, or a reduction in share capital may affect the number of shares outstanding. In addition, plan rules should explain when to exclude peer companies following mergers, delistings, or other exceptional events to maintain a fair and consistent comparison.
The Strengths of RTSR as a Performance Metric
1. Objective and Externally Verifiable
Unlike internal financial metrics (which can be influenced by accounting choices), RTSR is based on publicly available market data that any investor or auditor can independently verify.
2. Encourages Sustained Outperformance
Because RTSR is typically measured over a three-year period, it discourages short-term stock price manipulation and encourages management to focus on durable competitive value creation.
3. Strong Governance Credibility
RTSR is widely accepted by institutional investors, proxy advisors, and governance commentators as a rigorous performance metric. Including RTSR in an LTI plan generally reduces the risk of “say on pay” failures at annual general meetings.
4. Industry-Neutral Fairness
By comparing companies within the same sector, RTSR removes the effect of macroeconomic tailwinds that might benefit all companies in a bull market. Pay is linked to competitive performance, not just favorable market conditions.
The Limitations and Criticisms of RTSR
Despite its widespread adoption, RTSR is not without weaknesses. Compensation committees and plan designers should be aware of these potential drawbacks.
1. The “Low Base Price” Problem
If a company’s share price is unusually depressed at the start of the performance period, it is much easier to show strong TSR growth from that low base. Peer companies with a higher starting price face a mathematical disadvantage. This is why averaging starting share prices over 30–90 days is standard practice.
2. Sector and Index Volatility
In highly volatile sectors, even the best-managed company can find its TSR rank swinging dramatically based on macroeconomic events, commodity prices, or regulatory changes outside management’s control. RTSR penalizes or rewards executives for outcomes they may not have materially influenced.
3. Disconnect from Operational Reality
A company’s stock price can diverge significantly from its operational performance, especially in the short to medium term. RTSR may reward executives when the market re-rates their sector positively rather than when management makes genuinely superior strategic decisions.
4. Peer Group Gaming Risk
There is always a risk that management influences peer group selection in self-serving ways — choosing weaker peers to make outperformance easier. Robust governance, board oversight, and use of independent advisors are essential safeguards.
5. Small Peer Groups Amplify Luck
When the comparator group contains fewer than 15–20 companies, random stock movements can significantly shift a company’s percentile rank. Larger peer groups or index-based comparisons provide more statistical reliability.
Best Practices for Implementing RTSR in Your LTI Plan
For companies designing or refreshing their long-term incentive programs, the following principles represent current best practice in RTSR plan design.
Define Clear Plan Rules Upfront
All aspects of the RTSR calculation — peer group, averaging periods, dividend reinvestment assumptions, and payout curve — should be fully disclosed in plan rules and shareholder communications before the performance period begins. Retroactive changes undermine credibility.
Use a Robust, Stable Peer Group
Engage an independent compensation consultant to select and periodically review the peer group. Document the rationale for inclusion and exclusion decisions. Establish pre-agreed rules for handling mergers, delistings, and bankruptcies.
Combine RTSR with Absolute Financial Metrics
To address the risk that RTSR pays out during market downturns, combine it with metrics that reflect genuine business performance — such as EPS growth, revenue growth, ROIC, or free cash flow generation.
Consider an Absolute TSR Underpin
A growing governance trend is to include an absolute TSR underpin or gate: even if the company achieves a strong relative ranking, payouts may be reduced or eliminated if absolute shareholder returns are negative. This prevents executives from receiving large bonuses while shareholders have actually lost money.
Communicate Transparently
Shareholders and proxy advisors respond positively to clear, transparent explanations of how RTSR is measured, why the peer group was chosen, and how the payout curve was calibrated. Comprehensive disclosure in the remuneration report is essential.
RTSR Reporting and Disclosure Requirements
Publicly listed companies are generally required to disclose their LTI performance conditions, including RTSR, in their annual remuneration reports. The level of required detail varies by jurisdiction.
- United Kingdom — The Directors’ Remuneration Report (DRR), mandated under the Companies Act, requires full disclosure of all performance conditions, including RTSR peer groups and payout curves.
- United States — SEC proxy statement (DEF 14A) disclosure rules require detailed explanation of all performance metrics used in executive compensation, and the Compensation Discussion & Analysis (CD&A) section typically details RTSR plan design.
- European Union — The Shareholder Rights Directive II (SRD II) requires listed companies to publish a clear and comprehensible remuneration policy, including all performance conditions attached to variable pay.
How Technology Supports RTSR Plan Administration
Managing RTSR calculations across large peer groups, multiple performance cycles, and complex equity award structures is operationally demanding. Errors in TSR calculations can lead to incorrect vesting outcomes, participant disputes, and reputational damage.
Modern equity compensation management platforms, such as those offered by Incentrium, automate the RTSR calculation process, pulling in real-time market data, applying plan-specific averaging and dividend reinvestment rules, and generating auditable vesting calculations. This reduces administrative burden, minimizes error risk, and ensures full transparency for board reporting and participant communications.
Key technology capabilities to look for include:
- Automated peer group data feeds — real-time or end-of-period TSR calculations for all peer companies.
- Customizable payout curves — ability to input bespoke threshold/target/maximum points and interpolation methods.
- Scenario modeling tools — allowing compensation committees to model potential RTSR outcomes under different market conditions.
- Audit trails — complete documentation of all calculation inputs and outputs for regulatory and governance purposes.
Summary: Key Takeaways on RTSR Meaning
Understanding the full RTSR meaning is essential for anyone involved in executive compensation, corporate governance, or investor relations. Here is a concise summary of the key points:
- RTSR = Relative Total Shareholder Return — a measure of how a company’s stock performance (including dividends) compares to a peer group or index over a defined period.
- It is most commonly used as a performance condition in long-term incentive plans, typically attached to Performance Share Units (PSUs).
- RTSR is calculated by ranking individual TSR results within a peer group and expressing the outcome as a percentile rank, which then drives the equity award payout percentage.
- Standard payout structures use 25th percentile as threshold, 50th percentile (median) as target, and 75th percentile as maximum.
- RTSR is valued for its objectivity, competitive context, and strong governance credibility, but it has limitations including susceptibility to market volatility and peer group selection risks.
- Best practice involves combining RTSR with absolute financial metrics and implementing an absolute TSR underpin to ensure executives are not rewarded when shareholders have lost value.
- Robust technology platforms are essential for accurate, auditable RTSR administration at scale.
As governance expectations continue to evolve, RTSR will remain a cornerstone of performance-based executive pay, but its effectiveness depends entirely on thoughtful plan design, transparent disclosure, and rigorous administration.
FAQ
What is the RTSR meaning in executive compensation?
How is RTSR calculated?
What is a good RTSR percentile for maximum payout?
What are the main disadvantages of RTSR as a performance metric?
Written by
Dominik KonoldCEO & Founder
Dominik Konold is the CEO and founder of Finidy GmbH, specializing in share-based compensation and treasury accounting. With a background in audit and investment banking, he is a certified Professional Risk Manager (PRMIA) and lectures for the Association of Public Banks and the Academy of International Accounting.
Related Posts
Accelerated Vesting: How to Accelerate Your Vesting Schedule for Stock Options & Restricted Stock
This guide explains accelerated vesting, including single- and double-trigger acceleration, vesting schedules, equity grants, and what happens to employee equity during major corporate events.
Good Leaver: Definition, Clauses & Equity Rules Explained
This article explains what a good leaver is and how good leaver clauses and provisions affect employees, founders, and shareholders when they leave a company.
Bad Leaver: Definition, Clauses & Comparison to good leaver
This article explains the differences between good leavers and bad leavers and how their departure can affect equity, share options, and the company.
Ready to simplify your equity programs?
See how Incentrium helps you manage share-based compensation with ease. Book a demo to learn more.
Book a Demo